Our group handbook

Now that I lead a research group, I am rarely able to conduct research myself anymore. Instead, one my of main roles is to guide the others members of my group. Thus, one my new “areas of research” has necessarily become the topic of how to produce and maintain a vibrant, productive, and fun research group.

One situation that comes up often is orienting new hires (often called onboarding). In many cases, the process of getting new hires up to speed ends up operating like a traditional chain lift roller coaster. Before being dropped into serious work on their research project, a new member must very slowly “ascend the hill” by familiarizing themselves within the new research environment. In contrast, newer roller coasters generally launch you to high speeds straight away using technologies such as linear induction motors. These newer coasters enable riders to experience the wind in their hair for all but the first few seconds of the experience.

What might serve as the “linear induction motor” for onboarding new hires? One idea we are experimenting with is to have a single document (the HackingMaterials Handbook) that covers almost all the information new members need to get started. Although many other research groups maintain similar documentation, access to such documents are typically restricted to group members only. One of the things we are going to do differently is to release our handbook as a public document for anyone to see.

Why might sharing our group handbook be interesting for others? At the very least, sharing the document allows prospective members to preview how things are run inside our organization so that they can make an informed decision about whether to join our group. Other group leaders might refer to our guide when developing their own “new employee propulsion system” – for example, by copying the section headers and requesting that their group members help them fill in the details. Finally, our handbook contain general tips for research in computational materials science (such as recommending a good introductory textbook for learning density functional theory) that could be relevant to those outside our group.

The plan is for the handbook to be an iterative document that improves over time. The topics covered in the first release are:

  • About our group
  • Before you arrive
  • After arriving at LBNL
    • getting set up, situated, food + coffee, mail, equipment, conference rooms, the panic monster, sick leave, other issues
  • Making purchases
  • Booking conference travel
  • Asking your advisor for help
  • Friday Afternoon Tinkerings
  • Our computing systems
  • Resources for learning new topics
    • DFT, materials science, computer programming, data mining
  • Seven questions for self-assessment
  • Fun things to do in the area
  • Appendices
    • Finding a place to live
    • Purchasing a computer
    • Setting up a new Macbook
    • Notes on using a Mac
    • Open-source software philosophy
    • 10 tips to write better code
    • Hands-on exercises for machine learning in materials

Future releases will include more topics, provide more tips for being successful in research (e.g., how to write a paper), and will hopefully start to include some fun graphics/charts/illustrations. We are just getting started.

So – without further ado – you will always find our latest release of the handbook at:

Click to access handbook.pdf

We hope you will take a look and (perhaps) let us know what you think!


The Materials Paradox

One of the biggest outstanding questions about our physical universe is whether alien life exists amongst the stars. Similarly, the universe of materials is a strange, complex, and fascinating space where one of the biggest questions is whether new compounds with fantastic properties exist. But is anything out there? If you are optimistic about the existence of alien life, perhaps you share one belief with materials scientists that employ high-throughput screening to discover compounds: that given enough attempts, improbable events can become nearly inevitable. After all, shouldn’t winning the lottery be expected when one holds enough tickets?

In the search for alien life, the assumption that immense quantity should overpower rarity yields a conundrum referred to as “Fermi’s Paradox” . Fermi’s Paradox describes a set of back-of-the-envelope mathematics that predicts that, in all likelihood, we really ought to have stumbled into intelligent life within our galaxy by now (or rather, it should have stumbled into us). The details are encapsulated in a characteristically brilliant Wait But Why blog post,[1] but the basic ingredients of this analysis are (i) there are hundreds of billions of stars in our galaxy, (ii) amongst all those possibilities, a single civilization capable of interstellar travel could likely colonize our entire galaxy (that includes us) within a few million years, and (iii) Earth has been around for 4.5 billion years. So where are our alien neighbors? And what does this have to do with materials science?

In the past decade or so of high-throughput computations based on density functional theory (DFT), many materials scientists have asked a scaled-down and modified version of what is essentially the Fermi Paradox. I’ll refer to it as the “Materials Paradox”: why, if researchers can now screen tens or even hundreds of thousands of materials, isn’t there any major new material resulting from high-throughput screening that is either in the market or being seriously invested in by industry? Certainly there have been moderate successes.[2] But given all the calculated trials, one might reasonably expect that we would have by now uncovered something truly world-changing. So where – in the vast unexplored regions of chemical space – are the alternate and superior forms of technological materials, and why can’t we seem to find them?

The Materials Paradox has serious practical implications. If we can understand what makes high-throughput attempts successful (or not), perhaps we can modify our approach in important ways. What follows are some speculative thoughts (some more plausible than others) about why high-throughput materials discovery might be more difficult than it appears. In the spirit of the Wait But Why article on the Fermi Paradox, I’ve grouped these explanations into several categories.

Category A: There aren’t many interesting new materials to find

Possibility 1: The scientific process is already highly optimized to find good materials

Under this scenario, the best materials for a new technology are picked clean by the research community in a short amount of time, leaving little room for computational searches.

There is some evidence to indicate that the research community can be very efficient. Following the invention of the first Li-ion battery prototype in 1976 by Stanley Whittingham at Exxon, who employed a Li metal anode and a LiTiS2 cathode, other researchers rapidly identified better materials that still form the basis of most Li-ion batteries today (the graphite anode was developed between 1977 and 1980, and the LiCoO2 transition metal oxide cathode was identified in 1979). Although further materials optimization was necessary, and despite it taking until 1991 for commercialization to occur, the initial materials identification was remarkably quick. That said, Li-ion batteries can simultaneously be used as a counterexample if one believes that better materials are out there. In the past 3 to 4 decades, and despite a large amount of time and effort invested from many different players, there have only been a handful of significantly different and viable alternatives discovered. Thus, those that are optimistic about new types of Li-ion batteries must also admit that “business as usual” has not been completely fruitful.

Possibility 2: The range of possible materials properties is already well-covered by relatively “simple” materials, and it’s better to start with one of those and optimize

This possibility argues that there is no need to stretch to the outer reaches of the materials universe to optimize for an application; you can get pretty close to the best material using only “simple” compounds. That is, the low-hanging fruit is just as tasty as the difficult-to-reach fruit. To illustrate this idea, below is a range of DFT-GGA band gaps for about 50,000 compounds in the Materials Project, separated by the number of distinct elements in the compound (a proxy for complexity):

gap

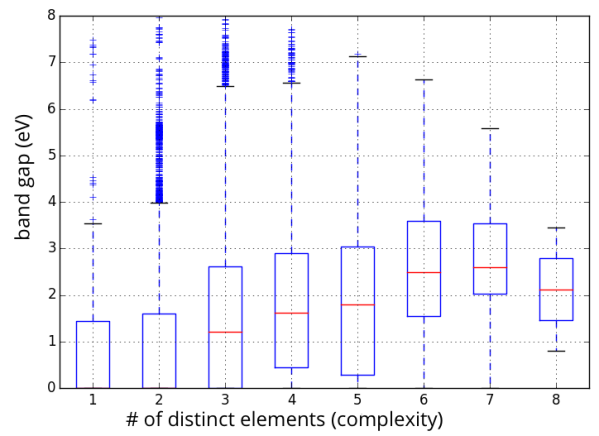
Statistics on range of accessible band gaps for elements, binaries, ternaries, and higher-order compounds.

The important thing to note about the figure above is that even “simple” binary compounds allow one to access almost a continuous range of band gap values from 0 to 8 eV (note that the average value of the band gap will be biased by the choice of compounds in the Materials Project, so I am focusing on the range). If one can access the desired properties with a simple binary material, which might also be easier to manufacture and already well-studied (e.g., how to synthesize it, process it, etc.), there may be little motivation to find more complex formulations that might only be moderately more promising. More research would need to be conducted before taking this possibility too seriously; in particular, one should at least consider the span of combinations of properties (rather than a single property such as band gap) that can be accessed by simple materials against those that are more complex.

Category B: Better materials exist, but there are logical reasons why we haven’t identified them with high-throughput screening

Possibility 3: DFT-based screening is not accurate or predictive enough

This explanation is one of the most common objections to DFT-based screening: materials are too complex to be assigned “pass”/”fail” marks by a theory that has well-known practical limitations.[3] It is a criticism also faced by those searching for extraterrestrial life (how do we know that our methods for identifying life are reliable and complete?) Some even argue that the screening process is destructive because one risks the possibility of miscalculating and reporting a “hit” compound as having poor properties, leading the research community off target. When weighing these criticisms, however, it is important to remember that all types of inquiry (whether computational or experimental) always carry at least some risk of missing an important result. Indeed, sometimes the situation is reversed, and calculations provide a fresh perspective on a material that is underperforming experimentally. It is only a problem insofar as one trusts a single measurement rather than weighing it against other knowledge. Furthermore, the potential for miscalculating can often be estimated, researched, and improved upon, and some residual uncertainty is not the same as lack of predictive power. Finally, practitioners would argue, the high-throughput screening process allows one to examine thousands of candidates that would typically be ignored completely, and thus the overall chances of finding a “hit” should certainly be improved versus limiting analysis to only the small set of compounds that could be intensively characterized with the same level of resources.

Possibility 4: “Conspiring filters” make it difficult for current high-throughput type approaches to succeed

In discussions of Fermi’s Paradox, the notion of a “great filter” is a situation that is exceedingly difficult for life to overcome on its trajectory to interstellar travel. Examples of potential “great filters” include meeting the conditions needed for life to form, evolving from prokaryotic to eukaryotic cells, surviving cataclysmic events such as comet collisions, or destroying oneself through the development of nuclear weapons or patricidal artificial intelligence.

In materials science, there may not be so many individual “great filters” to worry about, but there are plenty of examples of what I consider “conspiring filters”, i.e., a set of two or more constraints that are exceedingly difficult to pass simultaneously. Most recently, for example, I published an article about the difficulty of designing Li ion cathode materials that are both intrinsically safe and possess high voltage.[4] Compounds that exhibit both of these properties always appear to fail on a third criteria, the number of Li ions that can be stored. Conspiring filters crop up everywhere in materials design, for example in the development of steels that balance strength and ductility.

When faced with conspiring filters, finding a solution can be akin to inventing the materials equivalent of a “curveball”, i.e. not a better, faster version of the same old pitch but rather a genuinely new and perhaps wild idea that operates on different physical principles:

filters

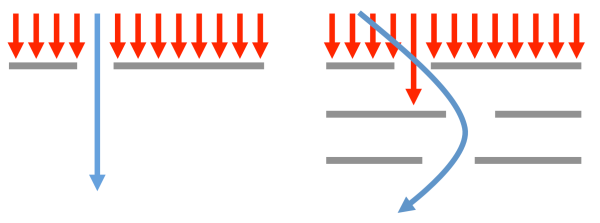
One can navigate through single filters using “more of the same”, but passing through conspiring filters may require a “curveball” strategy

Developing these “curveball” materials is (by definition) not straightforward and can also be difficult to implement.[5] For example, to overcome the strength versus ductility problem in steel design, one can employ non-obvious mechanisms such as transition induced plasticity (TRIP) or twinning induced plasticity (TWIP), which transform the local microstructure in the deformed regions of the material. A barrage of high-throughput computations would not find these mechanisms because they involve mixing phases at the microstructural level rather than identifying a single crystal structure that possesses all the desired properties. Similarly, high-throughput searches as they are conducted today would not identify hybrid perovskite solar cells (which mix organic and inorganic components) because that degree of substitutional freedom is typically not included in searches. In this latter case, the computations could be adapted to include both inorganic and organic components in the future, but this strategy must be specified a priori. The problem of navigating around conspiring filters without necessarily attacking “head-on” is one of the areas in which the high-throughput materials design community should spend more time on.

Category C: There exist external forces that prevent new materials discoveries from replacing incumbents

Possibility 5: Better materials can be found, but they suffer from arrested development due to unfair comparisons

Once identified, the performance of a material invariably improves over time as the research and development community continually test modifications and permutations to composition and processing. The NREL solar efficiency chart, for example, is one way to clearly see the performance of a set of materials improving over time.[6] The issue is that when new materials are identified, they are often immediately compared against the current performance of incumbents that have benefited from decades of optimization. Like comparing the height of a child versus that of a teenager, it can be very difficult to know who will eventually be the tallest. Early stage materials competing for an established market are often abandoned relatively quickly unless they can display something flashy (perhaps extreme performance in one attribute, at the expense of others) that will get the attention of a high-profile journal. It is possible that some very good materials have been nipped in the bud before having a chance to flower.

Category D: Just give it a bit more time!

Possibility 6: It’s too early to be making strong statements about high-throughput

High-throughput computational screening is only a little over a decade old, and only recently is it being adopted by more research groups than can be counted on one hand. It will take time for the field to hit its stride. As one encouraging example, I just got word that one of the earliest high-throughput screening studies (from the early 2000s), which was performed as part of a consulting project, is now seeing its predictions reach the consumer testing phase (I’m being purposefully cautious of unintentionally revealing any industry details I shouldn’t). Other examples might follow in due time, and “moderate successes” already appear to be piling up.[7] Perhaps it is inevitable that one day we will all purchase a device made of materials that were developed using computational screening techniques. Of course, one must be a little optimistic.

And who knows – maybe the same will be true for the aliens?

Footnotes:
[1] Wait But Why is currently one of my favorite blogs, and its treatment of the Fermi Paradox can be found here.
[2] Some colleagues and I covered some examples of new materials stemming from high-throughput DFT (but not yet used by industry) in this paper.
[3] I wrote a related blog article on this topic called “Here be dragons: should you trust a computational prediction?”.
[4] The paper discussing voltage versus intrinsic thermal stability in batteries can be found here.
[5] Apparently, the curveball pitch was difficult to implement in practice. Not only did the pitcher need to learn the mechanics of throwing this new pitch, but the catcher needed to change position entirely, moving from about 20-25 feet behind the batter (as was apparently typical in the day) to immediately behind the plate. When a big change is introduced, the whole system might need to be re-thought to make it work.
[6] The NREL solar efficiency chart can be found here.
[7] I have been trying to keep up with the list of materials predicted by computation and validated by experiment, and it certainly seems to be growing quickly.

The Materials Twitter Project: All my research papers in 140 characters or less

It seems that whenever I meet up with old colleagues, I eventually find out that they are working on a topic that (i) I had no clue they were interested in and (ii) that somehow relates to my current research. Perhaps a “battery person” is now studying solid state lighting, or a “DFT person” started using classical MD simulations. There has to be a better way to keep up!

Indeed, there are nowadays many tools (like Google Scholar) to help researchers discover relevant papers. But rather than talk about what I feel is missing from these tools, let me instead show you what I wish existed on a larger scale:

If you click that link (go ahead, it won’t bite), you’ll see each of my research papers distilled into a summary tweet of 140 characters each plus a second “business” tweet with the paper link/reference details. Given that each summary tweet is ~20 words and I’ve contributed to 32 papers, you can now read about every topic I’ve researched thus far in only ~650 words! The information content is extremely dense.

If you were to follow that feed, you would stay up-to-date on new topics like thermoelectrics and materials informatics that I plan to publish on soon, but that would be difficult to anticipate based on knowledge of my past research topics. Maybe there’s no overlap between our research today, but that’s often not a good predictor for future research intersections – at least that’s been the case with some of my colleagues.

Hopefully, you’re now thinking one (or both) of the following:

  • I wish I had one
  • I wish Colleagues X and Y had one

If so, maybe you want to already skip to the last section. But in case you need more convincing, here are a few more thoughts on the subject.

Why This Could Be Good for Followers  (if Authors use Twitter differently)

At this stage, you might correctly point out that many research groups already have Twitter feeds, and I’m a bit late to the party. Indeed, when I was signing up for Twitter, I was encouraged to follow some of them. But I didn’t want to follow those research feeds because they used Twitter in pretty much the same way that everyone else uses Twitter; namely, they post a lot (maybe about conference travel, maybe about external articles in their field). When they did announce a publication, it felt like just that: an announcement rather an informative paper summary. I’m sure this is already useful and interesting for many people, but I personally want an inverted (and introverted) Twitter, where posts are either “high-value, high-specificity” summaries of new papers from that research group or nothing at all. The idea is to keep it to around 10 posts per year(!) for someone that publishes at my current rate; in other words, nothing like most Twitter feeds. You could subscribe to 35 different research group feeds like mine and still receive only one tweet per day. The goal is not to feel pressure to keep your audience constantly engaged with updates. Hopefully, engagement will come from the availability of multiple different feeds.

For early adopters, the total payoff for being a follower will perhaps not be so great; with only a few groups posting (and maybe just me!), you’ll only get very sporadic updates. But the goal is that at every step of the way – and even in the beginning when the total payoff is not so large – the ratio of payoff to time invested will still be large because each tweet will be highly relevant/informative and take only seconds of your time. And the value will only continue to grow if more authors start feeds.

Besides, it’s supremely easy to follow and unfollow! So it’s an easy experiment to try out for a bit (understanding that things might be quiet at first).

Why This Could Be Good for Authors

From an author’s perspective, potential payoffs include broader dissemination of your work, added citations, and maybe new collaborations. Again, the total payoff might be big or small depending on the number of followers you get and who’s following your stream. But the time invested (140 characters per paper) is miniscule compared to other modes of broadcasting your research (e.g., traveling to a conference and filling out expense reports, or recording a video slideshow as some journals are now experimenting with). Thus, the ratio of payoff to time invested will be favorable even with a small number of followers and could become astronomical with a large number of followers.

How to get started as an author

If you’re on board, here are my suggestions for getting started:

  1. Decide whether to tweet your back catalog of papers or not. I tweeted all my past papers because I wanted my feed to be an example of what’s possible, but a better strategy may be to back-report papers published since some recent year (e.g., 2014 or 2015) or just your most recent paper. People will anyway be much more interested in future papers than past ones.
  2. Sign up for an account at Twitter.
  3. Begin by tweeting a paper’s link and reference details (business tweet). Twitter lets you delete tweets and re-post if you make a mistake, so no need to be nervous (but note that you can’t edit a previous tweet).You can use a quick and free service like bit.ly to shorten links[1]. Here’s an example that you can modify[2]:
    paper:"Relating voltage and thermal safety in Li-ion battery cathodes: a high-throughput ..."
    Jain et al, PCCP (2015)
    
  4. Next, self-reply to what you just tweeted[3]. Delete your handle from that reply, and add your 140 character summary tweet of that paper (see next point for hints). Here’s an example:
    DFT on >1400 compounds suggests cathodes >4.1V intrinsically prone to O2 release. Polyanions (XO4, X2O7) can raise V at expense of capacity
  5. When writing these summaries, try to distill important results and include numbers wherever possible. The goal is not to keep readers in suspense or “hook” someone into the full paper with a catchy headline, but rather to engineer the best first order approximation for the entire paper. Remember that if the tweet is already informative and helpful, then readers will extrapolate that the full paper must be really informative and helpful.
  6. Repeat as new papers come out. Appoint a Twitter feed “group job” if needed; it’s not much different than maintaining a publication list on your group page.

Congratulations! You now have your own feed and can start broadcasting. A few other notes:

  1. Resist the urge to tweet more than once about a single paper or to chain together multiple summary tweets to get extra space. Remember, the goal is to find a “Goldilocks” situation between a paper title (too vague) and paper abstract (too lengthy for skimming), and a single tweet is that perfect middle ground.
  2. Resist the urge to start posting about other things to keep your feed “busy”, like awards your group members have won, press about your paper, or links to some other person’s breakthrough paper in your field. Those things can be interesting, but should be separated into another stream for the smaller group of people who want the additional news and commentary. The occasional postdoc opening announcement (i.e., once per position opening) is probably fair and generally useful. But if the posts stop being of high value, followers should protest by unsubscribing (or kindly requesting that you separate your posts)!

There are plenty of other built-in tools that could potentially be useful (Twitter lists, retweets, hashtags, etc.), but those will only become relevant if this spreads. If you do end up starting your own Twitter feed, and in a way that meets these guidelines (i.e., not your typical Twitter feed), please let me know – you might even get your first follower!

Footnotes

[1] If you’re really savvy, you might prefer to link to DOIs rather than journal-specific URLs (I didn’t go that far).
[2] You can modify the “paper:” part of my example with “#paper” or “#publication” to be more in-line with how others use Twitter.
[3] The self-reply method links your “business tweet” and “summary tweet” together by a blue line.

Materials Project tutorial videos

Many people are curious about the Materials Project database, but don’t know how to get started. Here’s a series of YouTube tutorials covering many aspects of the Materials Project web site, from registration to data downloads via the programmatic REST API.

1. Registration

2. Get help and provide feedback

3. MP site overview

4. Materials Explorer – searching for materials data

5. Materials Explorer – the results table

6. Materials Explorer – compound details

7. The Materials API – download data programmatically

(the full series as a playlist)

Entomophobia!

In a scene from the movie Office Space, a trio of disgruntled programmers discover that a software glitch will expose their money laundering scheme:

PETER: You said the thing was supposed to work.
MICHAEL: Well, technically it did work.
PETER: No it didn’t!
SAMIR: It did not work, Michael, ok?!
MICHAEL: Ok! Ok!
SAMIR: Ok?!
MICHAEL: Ok! Ok! I must have, I must have put a decimal point in the wrong place or something. Shit. I always do that. I always mess up some mundane detail.
PETER: Oh! Well, this is not a mundane detail, Michael!

Unfortunately, major consequences stemming from small software problems are real. On February 25, 1991, during Operation Desert Storm, an Iraqi missile exploded in Saudi Arabia, killing 28 U.S. army members. This kind of event wasn’t supposed to happen because the United States had armed itself with the MIM-104 Patriot surface-to-air missile, capable of intercepting and wiping out ballistic missiles midair. The system failed because a software bug (using a 24-bit floating point number to represent the fraction 1/10) resulted in a very small roundoff error in the missile’s clock (0.000000095 seconds). The small error accumulated ten times per second, snowballing into a major problem. At the time of the attack, the roundoff error had become 0.34 seconds –  enough to get a missile trajectory wrong by almost half a mile.[1]

Today, the Materials Project electronic structure database has registered 9000 users. More importantly, by tracking citations we can see that they are actually using the data in their research and publications. This is certainly what we were hoping for, and we hope it continues. Yet, every time I see a Materials Project data point, phase diagram, or band structure in a paper, I cross my fingers that the results we’ve passed on are correct.

I’m overly paranoid probably because I (and others on the Materials Project team) spend inordinate amounts of time fixing problems in the Materials Project data. A search for the word “bug” in my email gives ~500 results in the past year (and there are additional “issues”, “problems”, and “errors”). Some of these are duplicates or unrelated to Materials Project, and the vast majority of these are minor and don’t affect any results. Still, trying to exterminate the Materials Project’s bugs can be somewhat maddening – the past few years have demonstrated that the infestation will always return, usually based on something that appears innocent at first glance. For example, on multiple occasions, code that incorrectly set (or failed to set) a single input tag ruined tens of thousands of dollars worth of computing and several weeks of work. Currently, we’re struggling to find out whether old bugs in a crystal structure matching code may have affected what we’ve computed and potentially any of the reported results; there have been hundreds of thousands of comparisons made using this code, and the results were used to set up later calculations and analyses. So far, things look OK.

We’re not alone in our problems; as summarized by Jeff Atwood and Steve Krug[2] for programming projects in general – you can find more problems in half a day than you can fix in a month. It’s normal for a large software project to be tracking a large number of issues at any given time. However, in high-throughput calculations the stakes are often higher because each piece of code is used to set up thousands of calculations. In response, we’ve recently been improving our nightly data validation scripts to catch at least the most glaring errors as soon as possible.

To help combat software errors, organizations such as Software Carpentry have started banging the drum for better software practices in the sciences. These efforts are timely: recently, 5 high-profile papers (including 3 Science papers) were retracted due to a small bug in a computer program used to determine biological crystal structures.[3] I wish Software Carpentry luck and applaud their efforts to hold workshops, provide resources, and start a conversation around this topic. At the same time, I wonder if they’ll actually reach their target audience. In particular, the bullet-pointed strategies they’ve published[4] (“put everything that has been created manually in version control”; “every piece of data must have a single authoritative representation in the system”) can ring like parental nagging (“eat your vegetables!”; “brush your teeth after every meal!”). Perhaps a better technique to encourage good software practices is to make it easy to do the right thing. For example, the web site Github has made it fun to use the complicated git version control system and furthermore makes it easy to adopt practices like issue tracking in a more natural and fluid way than explicit instruction.

Perhaps more importantly, many problems stem from miscommunication, not from failure to use the right tools or procedures. Going back to the Patriot missile software (presumably developed by well-funded software professionals, not scientists), the story doesn’t end with the round-off bug. Rather, the software was intended and tested for use in mobile applications and for tracking slower-moving targets in which the clock bug was not a factor. However, the software was later repurposed (inappropriately) for a more demanding application.[5] Similarly, for Materials Project, one of the major dangers is not necessarily the correctness of the data itself (so far, the published results look good) but whether our users understand the limitations of computed data when applying it to their problems. We recently added the option to pop-up a clarifying help guide on our materials details pages, but there’s much more we could do.

Similarly, developing and launching code under time pressure is responsible for many of the small mistakes that accumulate over time. Most organizations only learn the hard way that catastrophes are often rooted in peccadilloes. Astronaut Chris Hadfield summarizes it well[6] when describing historical tragedies in the space program – that the bigger the ambition of your project, the more important it is to pay attention to the smallest details:

“But when astronauts are killed on the job, the reason is almost always an overlooked detail that seemed unimportant at the time…
The Russians began wearing pressure suits for launch and landing only after a ventilation valve came loose and a Soyuz depressurized during re-entry in 1971, killing all three cosmonauts on board, likely within seconds. Shuttle astronauts started wearing pressure suits only after Challenger exploded during launch in 1986. In the case of both Challenger and Columbia, seemingly tiny details— a cracked O-ring, a dislodged piece of foam— caused terrible disasters. This is why, individually and organizationally, we have the patience to sweat the small stuff even when— actually, especially when— pursuing major goals. We’ve learned the hardest way possible just how much little things matter.”

* Author’s note: somewhat ironically, shortly after publishing this article I realized that it had a “bug”: the tone of the article was too one-sided towards doom and gloom. The current version tries to even things out a bit while keeping the overall message consistent. The original version is here.

Footnotes:
[1] I’m getting most of my information on the Patriot missile from this site.
[2] Jeff Atwood suggests prioritizing these bugs based on user complaints.
[3] The journal Nature has even started a “Digital Toolbox” section; an article summarizing the coding errors is here.
[4] See the paper “Best Practices for Scientific Computing” by Wilson et al.
[5] In addition to the Patriot missile example, the Computational science: …Error article from footnote #3 also includes an example where a scientific code is used outside of its intended parameter range, thereby leading to erroneous results being published.
[6] This excerpt is from Chris Hadfield’s book, “An Astronaut’s Guide to Life on Earth: What Going to Space Taught Me About Ingenuity, Determination, and Being Prepared for Anything”.

Don’t let the pressure affect you

One question that sometimes comes up regarding DFT computation (typically at zero pressure) is whether one can safely neglect the effect of pressure at ambient conditions. Here’s a simple back-of-the-envelope calculation that shows why it’s OK to neglect pressure under normal circumstances.

The effect of pressure on absolute energy

Under constant temperature and pressure conditions, the relevant thermodynamic potential is the Gibbs Free Energy, defined as:

G = U + PV - TS

where G is the Gibbs free energy, U is internal energy, P is pressure, V is volume, T is temperature and S is entropy. Since we’re doing a back-of-the-envelope calculation and want to single out pressure effects, let’s conduct our analysis at zero temperature.[1] Also let’s normalize extrinsic quantities per atom; the “per atom” versions will be denoted by lowercase letters:

g = u + Pv \mbox{ (at zero temperature; u, g and v normalized per atom)}

Clearly, the difference between g at finite pressure and zero pressure is the Pv term:

g_P - g_{0atm} = Pv

The value of P under ambient conditions is 100 kPa (105 Pa). For v (the volume per atom), let’s plug in values for Si, which has a 40 Angstrom3 unit cell containing 2 atoms,[2] so v ~ (20)*10-30 m3. So:

g_{1atm} - g_{0atm} = 2 * 10^{-24} J/atom \approx 10^{-5} eV/atom!

10-5 eV/atom is very small. For comparison, energy differences between different crystal structures are on the order of 10-2 eV/atom. The effect of ambient pressure on absolute energy is about 1000 times smaller than the quantities we care about! Note that the only real assumption in this analysis – other than zero temperature – was v, and this will not vary by too much between different compounds.

The effect of pressure on relative energies between phases

What matters physically is not absolute energy but relative energies between compounds. In particular, at high pressure compounds with smaller v (more dense) will have lower g and thus be preferred.

We can approximate the difference in g between two compounds due to pressure as:

\Delta g = P(v_1 - v_2)

All we need to evaluate this expression numerically are number densities for two different phases. Let’s choose two phases of Si – cubic ground state (v1 ~20 *10-30 m3) and high pressure (v2 ~14*10-30 m3).[2] Then:

\Delta G = (100,000 Pa)(6*10^{-30} m^{3}) \approx 3 * 10^{-6} eV/atom!

Again, the effect of ambient pressure is several orders of magnitude smaller than what we care about.

Of course, one could always crank up the pressure – a lot. For example, the high-pressure phase of Si is calculated to be about 0.3 eV/atom higher in energy than the ground state (according to DFT-GGA),4 making it quite unstable under ambient conditions. However, according to our calculation above, if we crank up the pressure to about 100,000 times ambient conditions,[3] the effect of pressure would be just enough to overcome the calculated energy difference. Nature agrees – Si is known to transition to the high-pressure form at 112,000 times pressure compared to ambient conditions.[4] So pressure can certainly have an effect in extreme conditions.

The effect of pressure on gases

The assumption that V is about the same order of magnitude for all compounds breaks down for gases. Fortunately, the product PV for a gas can be evaluated using the ideal gas law:

PV = kT  \approx 0.025 eV/atom! \mbox{(at 300K)}

Interestingly, the effect of pressure on the Gibbs free energy depends strongly on the temperature. Note that in contrast to solids, the effect of pressure on gases is large enough that it should be added to the calculations even in normal situations.

References

[1] Note that pressure can have an effect on S; a fundamental thermodynamic relation equates (\frac{\partial S}{\partial P})_T and -(\frac{\partial V}{\partial T})_P (or the product of the volume and coefficient of thermal expansion).
[2] I’m using experimental volumes for v at ambient pressure; they’re generally very close to DFT values. Data is from the Materials Project. Ground state (cubic) is mp-149, high pressure (beta-Sn) is mp-92.
[3] Note: to keep the math simple and easy for everyone to follow in their head, I was a bit sloppy with the rounding. If you follow the math more closely you would predict a transition closer to 75,000 times ambient pressure.
[4] Reported in “Phases of Silicon at High Pressure” by Hu and Spain.

Phase diagram comic

One of the more powerful tools in materials screening is the computational phase stability diagram. Unfortunately, it is only utilized at the moment by a few research groups (although I do see its usage increasing), and I thought that a comic book about them might improve the situation.

So here’s that comic book! In addition, this post contains Python examples to create, plot, and analyze phase diagrams using the pymatgen library and Materials Project database. You can now do what earlier took a month of research (computing and generating an entire ternary or quaternary phase diagram) in a few seconds!

This post has three parts:

  1. The comic!
  2. Interactive phase diagram examples
  3. Further resources

The comic!

Click here to download the full high quality PDF version (19MB) of the Phase Diagram comic.

There’s also a small file size version (3MB) for slower connections.

stability_comic_p1stability_comic_p2 stability_comic_p3

stability_comic_p4stability_comic_p5stability_comic_p6

Interactive phase diagram examples

Materials Project Phase Diagram App

MP_PDApp

The Materials Project phase diagram app allows one to access a database of tens of thousands of DFT calculations and construct interactive computational phase diagrams. You can build binary, ternary, and quaternary diagrams as well as open -element diagrams. No programming required!

Python code example: Creating a phase diagram


"""
This is a basic example of how to create, plot, and analyze Phase Diagrams using the pymatgen
codebase and Materials Project database. To run this example, you should:
* have pymatgen (www.pymatgen.org) installed along with matplotlib
* obtain a Materials Project API key (https://www.materialsproject.org/open)
* paste that API key in the MAPI_KEY variable below, e.g. MAPI_KEY = "foobar1234"
For citation, see https://www.materialsproject.org/citing
For the accompanying comic book, see http://www.hackingmaterials.com/pdcomic
"""
from pymatgen import MPRester
from pymatgen.entries.compatibility import MaterialsProjectCompatibility
from pymatgen.phasediagram.pdanalyzer import PDAnalyzer
from pymatgen.phasediagram.pdmaker import PhaseDiagram
from pymatgen.phasediagram.plotter import PDPlotter
if __name__ == "__main__":
MAPI_KEY = None # You must change this to your Materials API key! (or set MAPI_KEY env variable)
system = ["Fe", "P"] # system we want to get PD for
# system = ["Fe", "P", "O"] # alternate system example: ternary
mpr = MPRester(MAPI_KEY) # object for connecting to MP Rest interface
compat = MaterialsProjectCompatibility() # sets energy corrections and +U/pseudopotential choice
# Create phase diagram!
unprocessed_entries = mpr.get_entries_in_chemsys(system)
processed_entries = compat.process_entries(unprocessed_entries) # filter and add energy corrections
pd = PhaseDiagram(processed_entries)
# Plot!
plotter = PDPlotter(pd, show_unstable=False) # you can also try show_unstable=True
plotter.show()
# plotter.write_image("{}.png".format('-'.join(system)), "png") # save figure
# Analyze phase diagram!
pda = PDAnalyzer(pd)
print 'Stable Entries (formula, materials_id)\n——–'
for e in pd.stable_entries:
print e.composition.reduced_formula, e.entry_id
print '\nUnstable Entries (formula, materials_id, e_above_hull (eV/atom), decomposes_to)\n——–'
for e in pd.unstable_entries:
decomp, e_above_hull = pda.get_decomp_and_e_above_hull(e)
pretty_decomp = [("{}:{}".format(k.composition.reduced_formula, k.entry_id), round(v, 2)) for k, v in decomp.iteritems()]
print e.composition.reduced_formula, e.entry_id, "%.3f" % e_above_hull, pretty_decomp

view raw

pd_example.py

hosted with ❤ by GitHub

Python code example: Creating a grand canonical phase diagram


"""
This is a basic example of how to create, plot, and analyze OPEN Phase Diagrams using the pymatgen
codebase and Materials Project database. To run this example, you should:
* have pymatgen (www.pymatgen.org) installed along with matplotlib
* obtain a Materials Project API key (https://www.materialsproject.org/open)
* paste that API key in the MAPI_KEY variable below, e.g. MAPI_KEY = "foobar1234"
For citation, see https://www.materialsproject.org/citing
For the accompanying comic book, see http://www.hackingmaterials.com/pdcomic
"""
from __future__ import print_function
from pymatgen import MPRester, Element
from pymatgen.analysis.phase_diagram import GrandPotentialPhaseDiagram, \
PhaseDiagram, PDPlotter
def plot_pd(pd, show_unstable=False):
plotter = PDPlotter(pd, show_unstable=show_unstable)
plotter.show()
# plotter.write_image("{}.png".format('-'.join(system)), "png") # save figure
def analyze_pd(pd):
print('Stable Entries (formula, materials_id)\n——–')
for e in pd.stable_entries:
print(e.composition.reduced_formula, e.entry_id)
print('\nUnstable Entries (formula, materials_id, e_above_hull (eV/atom), decomposes_to)\n——–')
for e in pd.unstable_entries:
decomp, e_above_hull = pd.get_decomp_and_e_above_hull(e)
pretty_decomp = [("{}:{}".format(k.composition.reduced_formula, k.entry_id), round(v, 2)) for k, v in decomp.items()]
print(e.composition.reduced_formula, e.entry_id, "%.3f" % e_above_hull, pretty_decomp)
if __name__ == "__main__":
MAPI_KEY = None # You must change this to your Materials API key! (or set MAPI_KEY env variable)
system = ["Fe", "P", "O"] # system we want to get open PD for
# system = ["Li", "Fe", "P", "O"] # alternate system example
open_elements_specific = None # e.g., {Element("O"): 0} where 0 is the specific chemical potential
open_element_all = Element("O") # plot a series of open phase diagrams at critical chem pots with this element open
mpr = MPRester(MAPI_KEY) # object for connecting to MP Rest interface
# get data
entries = mpr.get_entries_in_chemsys(system, compatible_only=True)
if open_elements_specific:
gcpd = GrandPotentialPhaseDiagram(entries, open_elements_specific)
plot_pd(gcpd, False)
analyze_pd(gcpd)
if open_element_all:
pd = PhaseDiagram(entries)
chempots = pd.get_transition_chempots(open_element_all)
all_gcpds = list()
for idx in range(len(chempots)):
if idx == len(chempots) – 1:
avgchempot = chempots[idx] – 0.1
else:
avgchempot = 0.5 * (chempots[idx] + chempots[idx + 1])
gcpd = GrandPotentialPhaseDiagram(entries, {open_element_all: avgchempot}, pd.elements)
min_chempot = None if idx == len(chempots) – 1 else chempots[idx + 1]
max_chempot = chempots[idx]
print("Chempot range for diagram {} is: {} to {}".format(idx, min_chempot, max_chempot))
plot_pd(gcpd, False)
analyze_pd(gcpd)

view raw

gcpd_example.py

hosted with ❤ by GitHub

Python code example: Checking to see if your materials is stable with respect to compounds in the MP database


"""
This is a basic example of how to check a new material for stability using the pymatgen
codebase and Materials Project database. It assumes that you have already calculated
the energy of your predicted compound with DFT.
It is very important to note that this code does NOT do a detailed check to make sure
your computed energies are compatible with those in the Materials Project database
(i.e., uses the same functional, +U corrections, k-point mesh, etc). You must ensure
that the energies you provide are directly comparable with those in Materials Project,
otherwise this code will give you false results!
To run this example, you should:
* have pymatgen (www.pymatgen.org) installed
* obtain a Materials Project API key (https://www.materialsproject.org/open)
* paste that API key in the MAPI_KEY variable below, e.g. MAPI_KEY = "foobar1234"
as well as:
* update MY_COMPOSITION with the composition of your prediction
* update MY_ENERGY_PER_ATOM with the energy per atom (in eV) of your prediction (via DFT)
* update MY_PARAMETERS with the functional and POTCAR code, as well as any hubbards applied
For citation, see https://www.materialsproject.org/citing
For the accompanying comic book, see http://www.hackingmaterials.com/pdcomic
A similar script that directly reads VASP output files and checks stability is at:
https://gist.github.com/shyuep/3570304
"""
from pymatgen import MPRester, Composition
from pymatgen.entries.compatibility import MaterialsProjectCompatibility
from pymatgen.entries.computed_entries import ComputedEntry
from pymatgen.analysis.phase_diagram import PhaseDiagram
if __name__ == "__main__":
MAPI_KEY = None # You must change this to your Materials API key! (or set MAPI_KEY env variable)
MY_COMPOSITION = Composition("Fe5O8") # put the formula of your prediction
MY_ENERGY_PER_ATOM = -6.5 # note: this must be energy normalized PER ATOM in eV!
MY_PARAMETERS = {"potcar_symbols": ['pbe Fe_pv', 'pbe O'], "hubbards": {"Fe": 5.3}}
mpr = MPRester(MAPI_KEY) # object for connecting to MP Rest interface
compat = MaterialsProjectCompatibility() # sets energy corrections and +U/pseudopotential choice
# Create phase diagram!
unprocessed_entries = mpr.get_entries_in_chemsys([e.symbol for e in MY_COMPOSITION.elements])
processed_entries = compat.process_entries(unprocessed_entries) # filter and add energy corrections
# define user entry and add corrections
my_entry = ComputedEntry(MY_COMPOSITION, MY_ENERGY_PER_ATOM * MY_COMPOSITION.num_atoms,
parameters=MY_PARAMETERS)
corrections_dict = compat.get_corrections_dict(my_entry)
pretty_corrections = ["{}:{}".format(k, round(v, 3)) for k, v in corrections_dict.items()]
print("We are applying the following corrections (eV) to the user entry: {}".format(pretty_corrections))
my_entry.correction = sum(corrections_dict.values())
processed_entries.append(my_entry)
pd = PhaseDiagram(processed_entries)
if my_entry in pd.stable_entries:
print('Your entry {} with energy/atom {} is stable! Its "inverse hull energy" is {} eV/atom.'.format(MY_COMPOSITION, my_entry.energy_per_atom, "%.3f" % pd.get_equilibrium_reaction_energy(my_entry)))
else:
decomp, e_above_hull = pd.get_decomp_and_e_above_hull(my_entry)
pretty_decomp = [("{}:{}".format(k.composition.reduced_formula, k.entry_id), round(v, 2)) for k, v in decomp.items()]
print('Your entry {} with energy/atom {} eV/atom is unstable. Its "decomposition energy" is {} eV/atom. Its predicted decomposition is to: {}'.format(MY_COMPOSITION, "%.3f" % my_entry.energy_per_atom, "%.3f" % e_above_hull, pretty_decomp))
print('A rule of thumb is decomposition energy less than about 0.100 eV/atom might be considered "metastability", although this is not a quantitative statement.')
print('For more details, see Sun, W., Dacek, S. T., Ong, S. P., Hautier, G., Jain, A., Richards, W. D., Gamst, A. C., Persson, K. A. & Ceder, G. The thermodynamic scale of inorganic crystalline metastability. (2016).')

Further resources

“Accuracy of ab initio methods in predicting the crystal structures of metals: A review of 80 binary alloys” by Curtarolo et al.

curtarolo

This (somewhat epic!) paper contains data for 80 binary convex hulls computed with density functional theory. The results are compared with known experimental data and it is determined that the degree of agreement between computational and experimental methods is between 90-97%.

“A Computational Investigation of Li9M3(P2O7)3(PO4)2 (M = V, Mo) as Cathodes for Li Ion Batteries” by Jain et al.

jain

The endpoints of a binary convex hull need not be elements. For example, in the Li ion battery field one often searches for stable intermediate phases that form at certain compositions as lithium is inserted into a framework structure. The paper above is just one example of many computational Li ion battery papers that use such “pseudo-binary” convex hulls.

“Configurational Electronic Entropy and the Phase Diagram of Mixed-Valence Oxides: The Case of LixFePO4” by Zhou et al.

zhou

Incorporating temperature into first-principles convex hulls is often possible, but not always straightforward or easy to do. Here is one example of this process that focuses on electronic entropy.

Wikipedia article on Ternary plots

Ternary_plot_2_(reverse_axis)

Ternary plots are not only for phase diagrams (the most creative usage I’ve ever seen is in Scott McCloud’s Understanding Comics, where it is used to explain the language of art and comics). Wikipedia does a good job of explaining the basics of how to read and interpret compositions on ternary diagrams.

“Li-Fe-P-O2 phase diagram from first principles calculations” by Ong et al.

wang-lfpo

Here is a nice example of the computation of a quaternary phase diagram – sliced into ternary sections – from first principles calculations.

“Accuracy of density functional theory in predicting formation energies of ternary oxides from binary oxides and its implication on phase stability” by Hautier et al.

hautier-accuracy

How accurate are computational phase diagrams? The correct answer, like always, is “it’s complicated”. But based on results from this paper and some experience, colleagues of mine and I have found that an error bar of 25 meV/atom is usually a good estimate. We usually double that to 50 meV/atom when searching for materials to synthesize by conventional methods.

“Formation enthalpies by mixing GGA and GGA + U calculations” by Jain et al.

Jain-mixing

In an ideal world, first principles calculations would live up to their name and require no adjustable parameters. In practice, however, DFT errors do not always cancel when comparing energies of compounds with different types of electronic states. This paper shows how one can mix two DFT approximations along with some experimental data in order to produce a correct phase diagram across a changing landscape of electronic states.

“First-Principles Determination of Multicomponent Hydride Phase Diagrams: Application to the Li-Mg-N-H System” by Akbarzadeh et al.

wolverton-h2

An alternate (but equivalent) approach to the convex hull algorithm for determining phase diagrams is to use a linear programming approach. This is demonstrated by Akbarzadeh et al. in the search for H2 sorbents.

“Thermal stabilities of delithiated olivine MPO4 (M = Fe, Mn) cathodes investigated using first principles calculations” by Ong et al.

ong-safety


If Li ion battery cathode materials (generally oxygen-containing compounds) release O2 gas from their lattice, it can lead to runaway electrolyte reactions that cause fire. Thus, a safe cathode material resists O2 release even under extreme conditions. Stated another way, safety is the “price point” (inverse O2 chemical potential) at which a cathode material will give up its oxygen. The higher the price point, the more stable the compound. This paper compares the critical chemical potential for O2 release between MnPO4 and FePO4 cathode materials, finding that similar chemistry and structure doesn’t necessarily imply similar safety.

“CO2 capture properties of M–C–O–H (M.Li, Na, K) systems: A combined density functional theory and lattice phonon dynamics study” by Duan et al.

duan-co2

The CO2 capture problem is to find a compound that absorbs CO2 from an open environment at chemical potentials found in industrial processes, and then releases the CO2 back into some other open environment under sequestration conditions. This paper constructs multi-dimensional phase diagrams to predict how different chemical systems will react with CO2 under different conditions.


Phase Diagram comic: part 5

Important note: if you are just joining us, you probably want to go back and start from the first page of the Phase Diagram comic!

With page 5, we’re nearing the end of the phase diagram adventure. This page explains open element phase diagrams in what I think is an intuitive (and perhaps new) way. Stay tuned for the next post, which will contain the full phase diagram comic (including the final page) and bring the journey to an end!

stability_comic_p5

To be continued…

Further resources

“Thermal stabilities of delithiated olivine MPO4 (M = Fe, Mn) cathodes investigated using first principles calculations” by Ong et al.

ong-safety


If Li ion battery cathode materials (generally oxygen-containing compounds) release O2 gas from their lattice, it can lead to runaway electrolyte reactions that cause fire. Thus, a safe cathode material resists O2 release even under extreme conditions. Stated another way, safety is the “price point” (inverse O2 chemical potential) at which a cathode material will give up its oxygen. The higher the price point, the more stable the compound. This paper compares the critical chemical potential for O2 release between MnPO4 and FePO4 cathode materials, finding that similar chemistry and structure doesn’t necessarily imply similar safety.

“CO2 capture properties of M–C–O–H (M.Li, Na, K) systems: A combined density functional theory and lattice phonon dynamics study” by Duan et al.

duan-co2

The CO2 capture problem is to find a compound that absorbs CO2 from an open environment at chemical potentials found in industrial processes, and then releases the CO2 back into some other open environment under sequestration conditions. This paper constructs multi-dimensional phase diagrams to predict how different chemical systems will react with CO2 under different conditions.


Phase Diagram comic: part 4

Important note: if you are just joining us, you probably want to go back and start from the first page of the Phase Diagram comic!

After a hiatus, the phase diagram comic is back! Page 4 is about generating and interpreting ternary and higher phase diagrams. This will lead to the next page, which is going to try to make the extremely useful but generally confusing “grand canonical” construction a bit friendlier. For now, be sure to check out “Further Resources” below the comic for more information!

Also, thanks to Parker Sear for a comment that led directly to panel 8 (expt. vs. computational) of the comic!


stability_comic_p4

To be continued…

Further resources

Wikipedia article on Ternary plots

Ternary_plot_2_(reverse_axis)

Ternary plots are not only for phase diagrams (the most creative usage I’ve ever seen is in Scott McCloud’s Understanding Comics, where it is used to explain the language of art and comics). Wikipedia does a good job of explaining the basics of how to read and interpret compositions on ternary diagrams.

“Li-Fe-P-O2 phase diagram from first principles calculations” by Ong et al.

wang-lfpo

Here is a nice example of the computation of a quaternary phase diagram – sliced into ternary sections – from first principles calculations.

“Accuracy of density functional theory in predicting formation energies of ternary oxides from binary oxides and its implication on phase stability” by Hautier et al.

hautier-accuracy

How accurate are computational phase diagrams? The correct answer, like always, is “it’s complicated”. But based on results from this paper and some experience, colleagues of mine and I have found that an error bar of 25 meV/atom is usually a good estimate. We usually double that to 50 meV/atom when searching for materials to synthesize by conventional methods.

“Formation enthalpies by mixing GGA and GGA + U calculations” by Jain et al.

Jain-mixing

In an ideal world, first principles calculations would live up to their name and require no adjustable parameters. In practice, however, DFT errors do not always cancel when comparing energies of compounds with different types of electronic states. This paper shows how one can mix two DFT approximations along with some experimental data in order to produce a correct phase diagram across a changing landscape of electronic states.

“First-Principles Determination of Multicomponent Hydride Phase Diagrams: Application to the Li-Mg-N-H System” by Akbarzadeh et al.

wolverton-h2

An alternate (but equivalent) approach to the convex hull algorithm for determining phase diagrams is to use a linear programming approach. This is demonstrated by Akbarzadeh et al. in the search for H2 sorbents.


Phase Diagram comic: part 3

Important note: if you are just joining us, you probably want to go back and start from the first page of the Phase Diagram comic!

After a couple of pages of preliminaries, we are finally ready to discuss some materials science! Whereas page 2 employed convex hulls to maximize profits in a hypothetical bike shop, page 3 applies the same formalism to determine thermodynamic stability and demonstrate how chemical compounds can decompose to minimize energy.

And the adventure is far from over! In fact, next time we’ll add a whole new dimension to our analysis! For now, be sure to check out “Further Resources” below the comic for more information.

stability_comic_p3

To be continued…

Further resources:

“Accuracy of ab initio methods in predicting the crystal structures of metals: A review of 80 binary alloys” by Curtarolo et al.

curtarolo

This (somewhat epic!) paper contains data for 80 binary convex hulls computed with density functional theory. The results are compared with known experimental data and it is determined that the degree of agreement between computational and experimental methods is between 90-97%.

“A Computational Investigation of Li9M3(P2O7)3(PO4)2 (M = V, Mo) as Cathodes for Li Ion Batteries” by Jain et al.

jain

The endpoints of a binary convex hull need not be elements. For example, in the Li ion battery field one often searches for stable intermediate phases that form at certain compositions as lithium is inserted into a framework structure. The paper above is just one example of many computational Li ion battery papers that use such “pseudo-binary” convex hulls.

“Configurational Electronic Entropy and the Phase Diagram of Mixed-Valence Oxides: The Case of LixFePO4” by Zhou et al.

zhou

Incorporating temperature into first-principles convex hulls is often possible, but not always straightforward or easy to do. Here is one example of this process that focuses on electronic entropy.

Materials Project Phase Diagram App

The Materials Project phase diagram app allows one to construct interactive binary convex hulls for any system by employing computed data on tens of thousands of compounds. You can also create phase stability diagrams for ternaries and higher!


applying computing to materials design